


Influenza vaccine data
Data and statistics about the rollout of the 2026 flu vaccine campaign in New Zealand.
About the influenza (flu) vaccine data
Immunisation data is collected from the Aotearoa Immunisation Register (AIR) and is collated weekly. We report all publicly funded, and some privately funded, flu vaccines on the AIR. Not all the privately funded vaccines are recorded in our registries, which means the total number of vaccines administered will be higher than reported.
The vaccination data on this page is up to 28 September 2025. This page is updated weekly at 1pm on Thursday during the flu season. Note the final update to the content of this page will be made once the flu season ends for the year, typically end of September.
Our reporting is focused on the 2026 funded age group.
Details of when the vaccine is funded is available on our flu vaccine page.
Total vaccinations up to 28 September 2025
| Data / Ethnicity | Māori | Pacific Peoples | Asian | Other | Total |
| Week: 22 to 28 September | 210 | 236 | 590 | 801 | 1,837 |
| Total YTD vaccinations for people aged 65 and older | 36,465 | 18,775 | 46,880 | 465,383 | 567,503 |
| Total YTD vaccinations | 98,918 | 59,125 | 204,101 | 866,487 | 1,228.631 |
Definitions
- Ethnicity (prioritised)
- Each person is only counted against a single ethnicity category. When a person has multiple ethnicities recorded, the prioritised ethnicity is ranked in the order of:
-
- Māori
- Pacific Peoples
- Asian
- Other.
- For example, if a person is recorded as their ethnicities being both Māori and Pacific Peoples, their prioritised ethnicity will be Māori, and they will not be counted in the Pacific Peoples group.
- Year to date (YTD)
- Vaccinations occurring from 1 March to 30 September every year.
Vaccinations by district
Number of vaccinations by district and prioritised ethnicity. Figures are based on where the person lives, which may differ from where they got their vaccine.
| District | Māori | Pacific Peoples | Asian | Other | Total |
| Auckland | 5,712 | 9,354 | 39,532 | 67,779 | 122,377 |
| Bay of Plenty | 7,102 | 828 | 3,784 | 45,730 | 57,444 |
| Canterbury | 8,473 | 3,048 | 20,083 | 138,349 | 169,953 |
| Capital and Coast | 6,408 | 4,243 | 15,157 | 74,165 | 99,973 |
| Counties Manukau | 9,342 | 22,832 | 39,339 | 46,041 | 117,554 |
| Hawkes Bay | 5,552 | 1,154 | 2,387 | 32,210 | 41,303 |
| Hutt Valley | 3,952 | 2,383 | 7,302 | 30,342 | 43,979 |
| Lakes | 4,506 | 469 | 1,779 | 15,864 | 22,618 |
| MidCentral | 3,957 | 828 | 3,637 | 35,310 | 43,732 |
| Nelson Marlborough | 2,338 | 670 | 2,199 | 38,664 | 43,871 |
| Northland | 7,787 | 561 | 1,895 | 28,785 | 39,028 |
| South Canterbury | 665 | 152 | 938 | 14,967 | 16,722 |
| Southern | 5,041 | 1,532 | 6,887 | 76,956 | 90,416 |
| Tairawhiti | 3,440 | 461 | 529 | 5,558 | 9,988 |
| Taranaki | 2,672 | 360 | 1,469 | 24,284 | 28,785 |
| Waikato | 10,601 | 2,273 | 11,757 | 69,830 | 94,461 |
| Wairarapa | 1,236 | 273 | 622 | 12,311 | 14,442 |
| Waitemata | 7,102 | 7,300 | 43,806 | 89,571 | 147,779 |
| West Coast | 565 | 80 | 335 | 6,739 | 7,719 |
| Whanganui | 2,433 | 303 | 583 | 12,765 | 16,084 |
| Total | 98,918 | 59,125 | 204,101 | 866,487 | 1,228,631 |
Vaccination uptake — age 65 years or more
Uptake percent is calculated by comparing the flu doses to date for this year with the estimated number of people in Aotearoa New Zealand who are aged 65 and over.
The estimated population is sourced from AIR and validated against the National Health Index (NHI) and National Enrolment Service (NES) registers.
| District | Māori | Māori % | Pacific | Pacific Peoples % | Asian | Asian % | Other | Other % | Total | Total % |
| Auckland | 1,678 | 54% | 3,381 | 52% | 10,697 | 52% | 29,422 | 63% | 45,178 | 59% |
| Bay of Plenty | 3,365 | 49% | 204 | 49% | 633 | 42% | 29,727 | 59% | 33,929 | 58% |
| Canterbury | 2,575 | 60% | 661 | 50% | 3,266 | 51% | 69,507 | 69% | 76,009 | 67% |
| Capital and Coast | 1,599 | 60% | 1,453 | 55% | 3,038 | 56% | 28,950 | 71% | 35,040 | 68% |
| Counties Manukau | 3,213 | 54% | 7,532 | 52% | 11,513 | 53% | 26,015 | 60% | 48,273 | 56% |
| Hawkes Bay | 2,225 | 50% | 263 | 51% | 360 | 45% | 19,979 | 64% | 22,827 | 62% |
| Hutt Valley | 1,197 | 56% | 779 | 57% | 1,510 | 57% | 13,784 | 68% | 17,270 | 65% |
| Lakes | 2,077 | 49% | 162 | 52% | 295 | 47% | 9,945 | 59% | 12,479 | 57% |
| MidCentral | 1,556 | 49% | 249 | 47% | 777 | 53% | 21,203 | 63% | 23,785 | 61% |
| Nelson Marlborough | 907 | 56% | 95 | 47% | 236 | 51% | 23,849 | 63% | 25,087 | 63% |
| Northland | 3,642 | 45% | 218 | 47% | 317 | 47% | 19,986 | 54% | 24,163 | 52% |
| South Canterbury | 256 | 57% | 22 | 39% | 78 | 45% | 9,332 | 65% | 9,688 | 65% |
| Southern | 1,683 | 58% | 298 | 53% | 614 | 51% | 41,509 | 66% | 44,104 | 65% |
| Tairawhiti | 1,486 | 49% | 55 | 51% | 37 | 37% | 3,560 | 59% | 5,138 | 56% |
| Taranaki | 1,140 | 53% | 59 | 51% | 204 | 50% | 14,668 | 62% | 16,071 | 61% |
| Waikato | 4,178 | 49% | 658 | 49% | 2,064 | 47% | 41,242 | 60% | 48,142 | 58% |
| Wairarapa | 454 | 52% | 61 | 55% | 78 | 50% | 7,439 | 64% | 8,032 | 63% |
| Waitemata | 2,298 | 53% | 2,518 | 51% | 10,820 | 50% | 46,858 | 59% | 62,494 | 57% |
| West Coast | 235 | 54% | 20 | 62% | 31 | 51% | 4,217 | 55% | 4,503 | 55% |
| Whanganui | 1,086 | 55% | 89 | 49% | 100 | 47% | 8,377 | 62% | 9,652 | 61% |
| Total | 36,862 | 52% | 18,781 | 52% | 46,675 | 51% | 469,659 | 63% | 571,977 | 60% |
Vaccination uptake over time — age 65 years or more
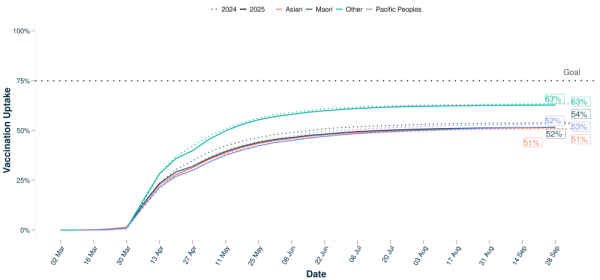
This line graph shows flu vaccine uptake for people aged 65 or older, from the first week in March to the last week in September, with each point representing the week ending on that date, for both 2024 and 2025. The data is broken down by the ethnicities:
- Māori
- Pacific Peoples
- Asian
- Other.
The graph shows a sharp uptake in the flu vaccine between 30 March to 25 May for both years, for all ethnic groups.
As of the end of this week, the uptake % for each year by ethnic group is as follows.
| Ethnicity | 2025 uptake | 2026 uptake |
| Māori | 52% | Data to come |
| Pacific Peoples | 52% | Data to come |
| Asian | 51% | Data to come |
| Other | 63% | Data to come |
Vaccinations per week for all age groups
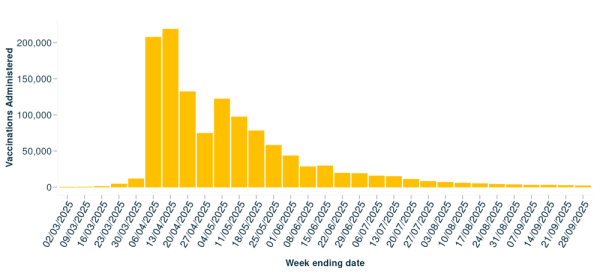
This bar graph shows flu vaccinations administered from the first week in March to the last week in September, with each point representing the week ending on that date. For all age groups and ethnicities:
- there were minimal vaccinations administered in March
- the majority of vaccinations were administered in the first 2 weeks of April, with over 200,000 each week
- the number of vaccinations administered slowed gradually from the middle of April until the end of September.
Notes on report data
- Immunisation data is sourced from the Aotearoa Immunisation Register (AIR) which includes migrated information from the COVID-19 Register (CIR) and National Immunisation Register (NIR) and collated weekly.
- As of 2025, a few changes have been introduced into how the numbers are calculated and displayed.
- Vaccination uptake calculation is based on a snapshot of the estimated eligible population in the AIR as at 01 March of the current year. This snapshot does not take into account any deaths or births that occur during the influenza season, so that the uptake can be observed against a static population.
- Age group is determined by age as at 30 September of the current year to ensure uptake captures not only those who are eligible for funded vaccination at the start but also those who become eligible over the course of the season. This definition was updated on 28 August 2025; prior to this change, age was calculated at the start of the influenza season.
- Totals include those whose assigned domicile district is overseas or unknown, but the actual numbers of overseas or unknown district will not be displayed to protect data confidentiality.
- Data captured on paper or systems other than AIR are not included.
- The data contains public and privately funded influenza vaccinations. Following the 2021 influenza season we have seen a higher proportion of privately funded vaccines being recorded. This is due to additional immunisation registries and the ability of pharmacies and other providers being able to record vaccinations. Data between years, therefore, are not directly comparable.